NC Climate Dashboard
A collaborative project with
the North Carolina Climate Office
Overview
Fall 2019 NCSU school project
This project started with a collaboration between a representative from the North Carolina Climate Office and our MGD group study at NCSU to find a solution to help better display complex information about the drought in a way that can be useful to both experts and non-experts.
It was developed and refined over the course of weeks through a series of meetings with the representative from the NC Climate Office, culminating in a final presentation of unique climate map interface concepts in person at the Climate Office.
Product
↳ Dashboard Design
My Role
↳ Researcher, UI Designer
Duration
↳ 12 days
Software
↳ Illustration, Photoshop, Keynote
Client
Design Goals
- Designing prototype for a drought dashboard for North Carolina Climate Office.
- Creating individual screens for interaction storyboards.
- Developing design strategies to overcome visual challenges related to complexity.
- Develop tailored, sector-specific information relevant to drought decisions.
- Deliver information in an accessible and actionable format.
- Improve the transparency of the drought monitoring process through enhanced engagement and communications with decision-makers.
Challenges
- Show as much data as possible without overwhelming the system for the user.
- Designing the dashboard with split-view mode.
- Designing in a way so that users can make comparisons across 2D assets arranged in a 2D space.
Discovery
This project focuses on improving the usability of drought-relevant information for North Carolina decision-makers based on needs identified by the NC Drought Management Advisory Council (DMAC) and constituents such as NC Cooperative Extension agents and public water supply system managers.
The motivation for the project stemmed from needs articulated by North Carolina decision-makers for improved drought information and communications. These needs include a better understanding of how drought is monitored, the climatic and environmental conditions that can cause or worsen drought conditions, and drought impacts on various sectors including agriculture, forestry, and water resources.
Research and Mockup
At the start, we had very few specifications for this project, so each week with the information that we found useful to the project, we designed a mockup of a potential visualization style.
We then presented our mockups in several meetings to our liaison from the climate office, and discussed what types of information and visualization might be useful or not, refining the project as we went along.
In the following sections, I showcase some of the mockups.
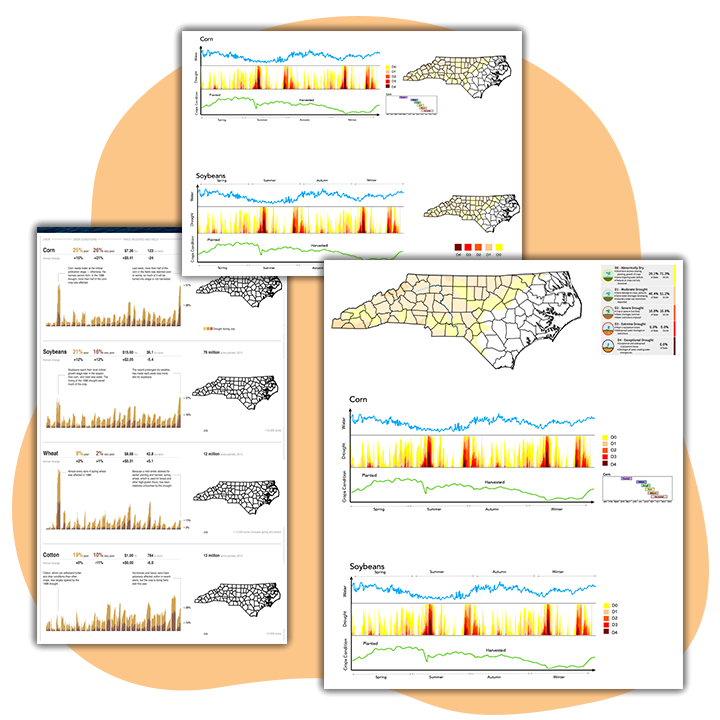
Mockup #1
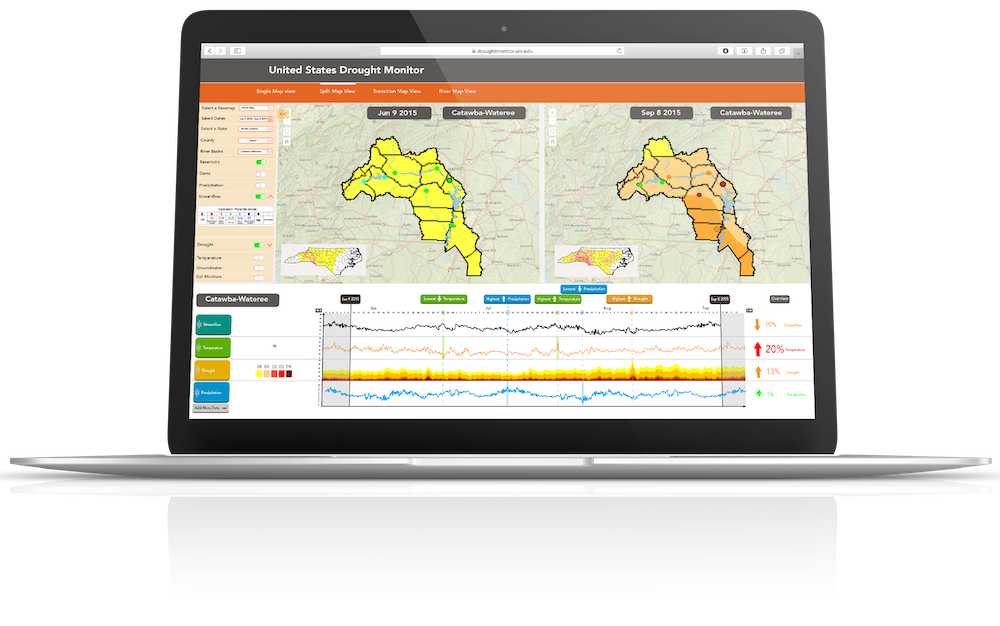
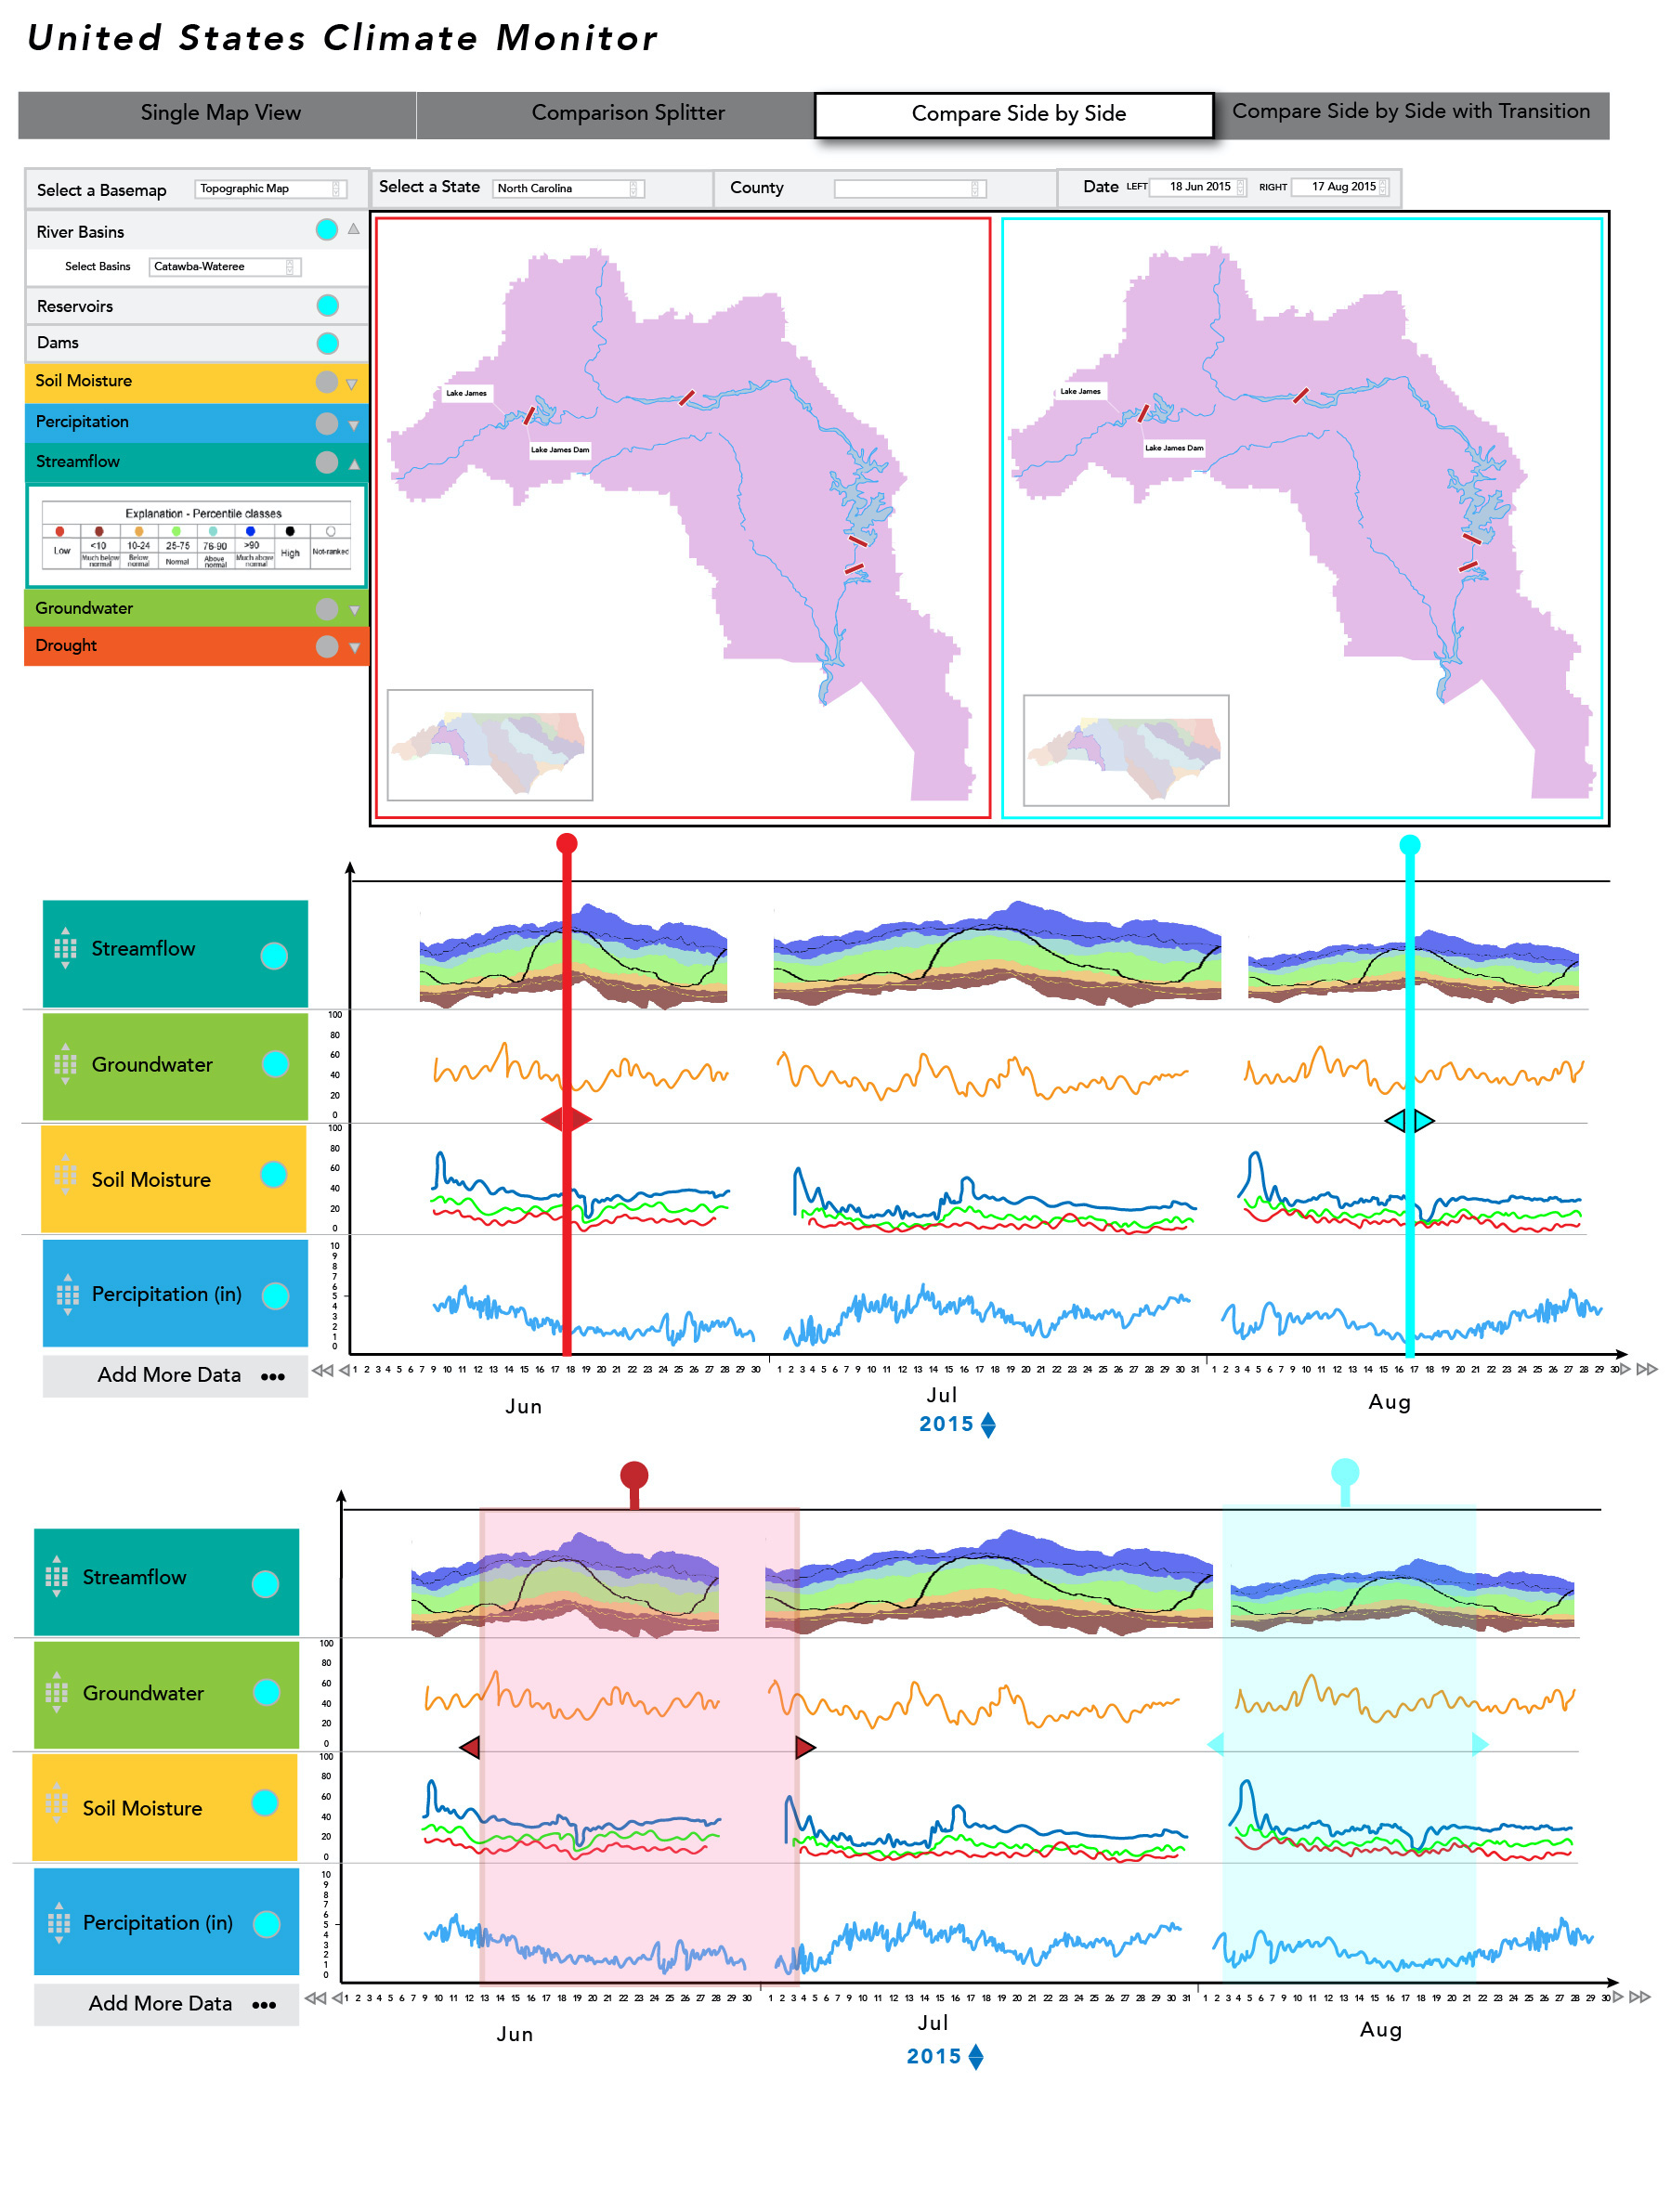
One of the mockups that I design to present was The United States Climate Monitor.
This mockup demonstrates how the user can see and filter for different levels of information about the climate by region, date, and other climate factors such as river basins, and drought, precipitation, streamflow level.
In the first part, the user can see the information on the map. And in the second part, the user can select what information to see in the timeline chart view.
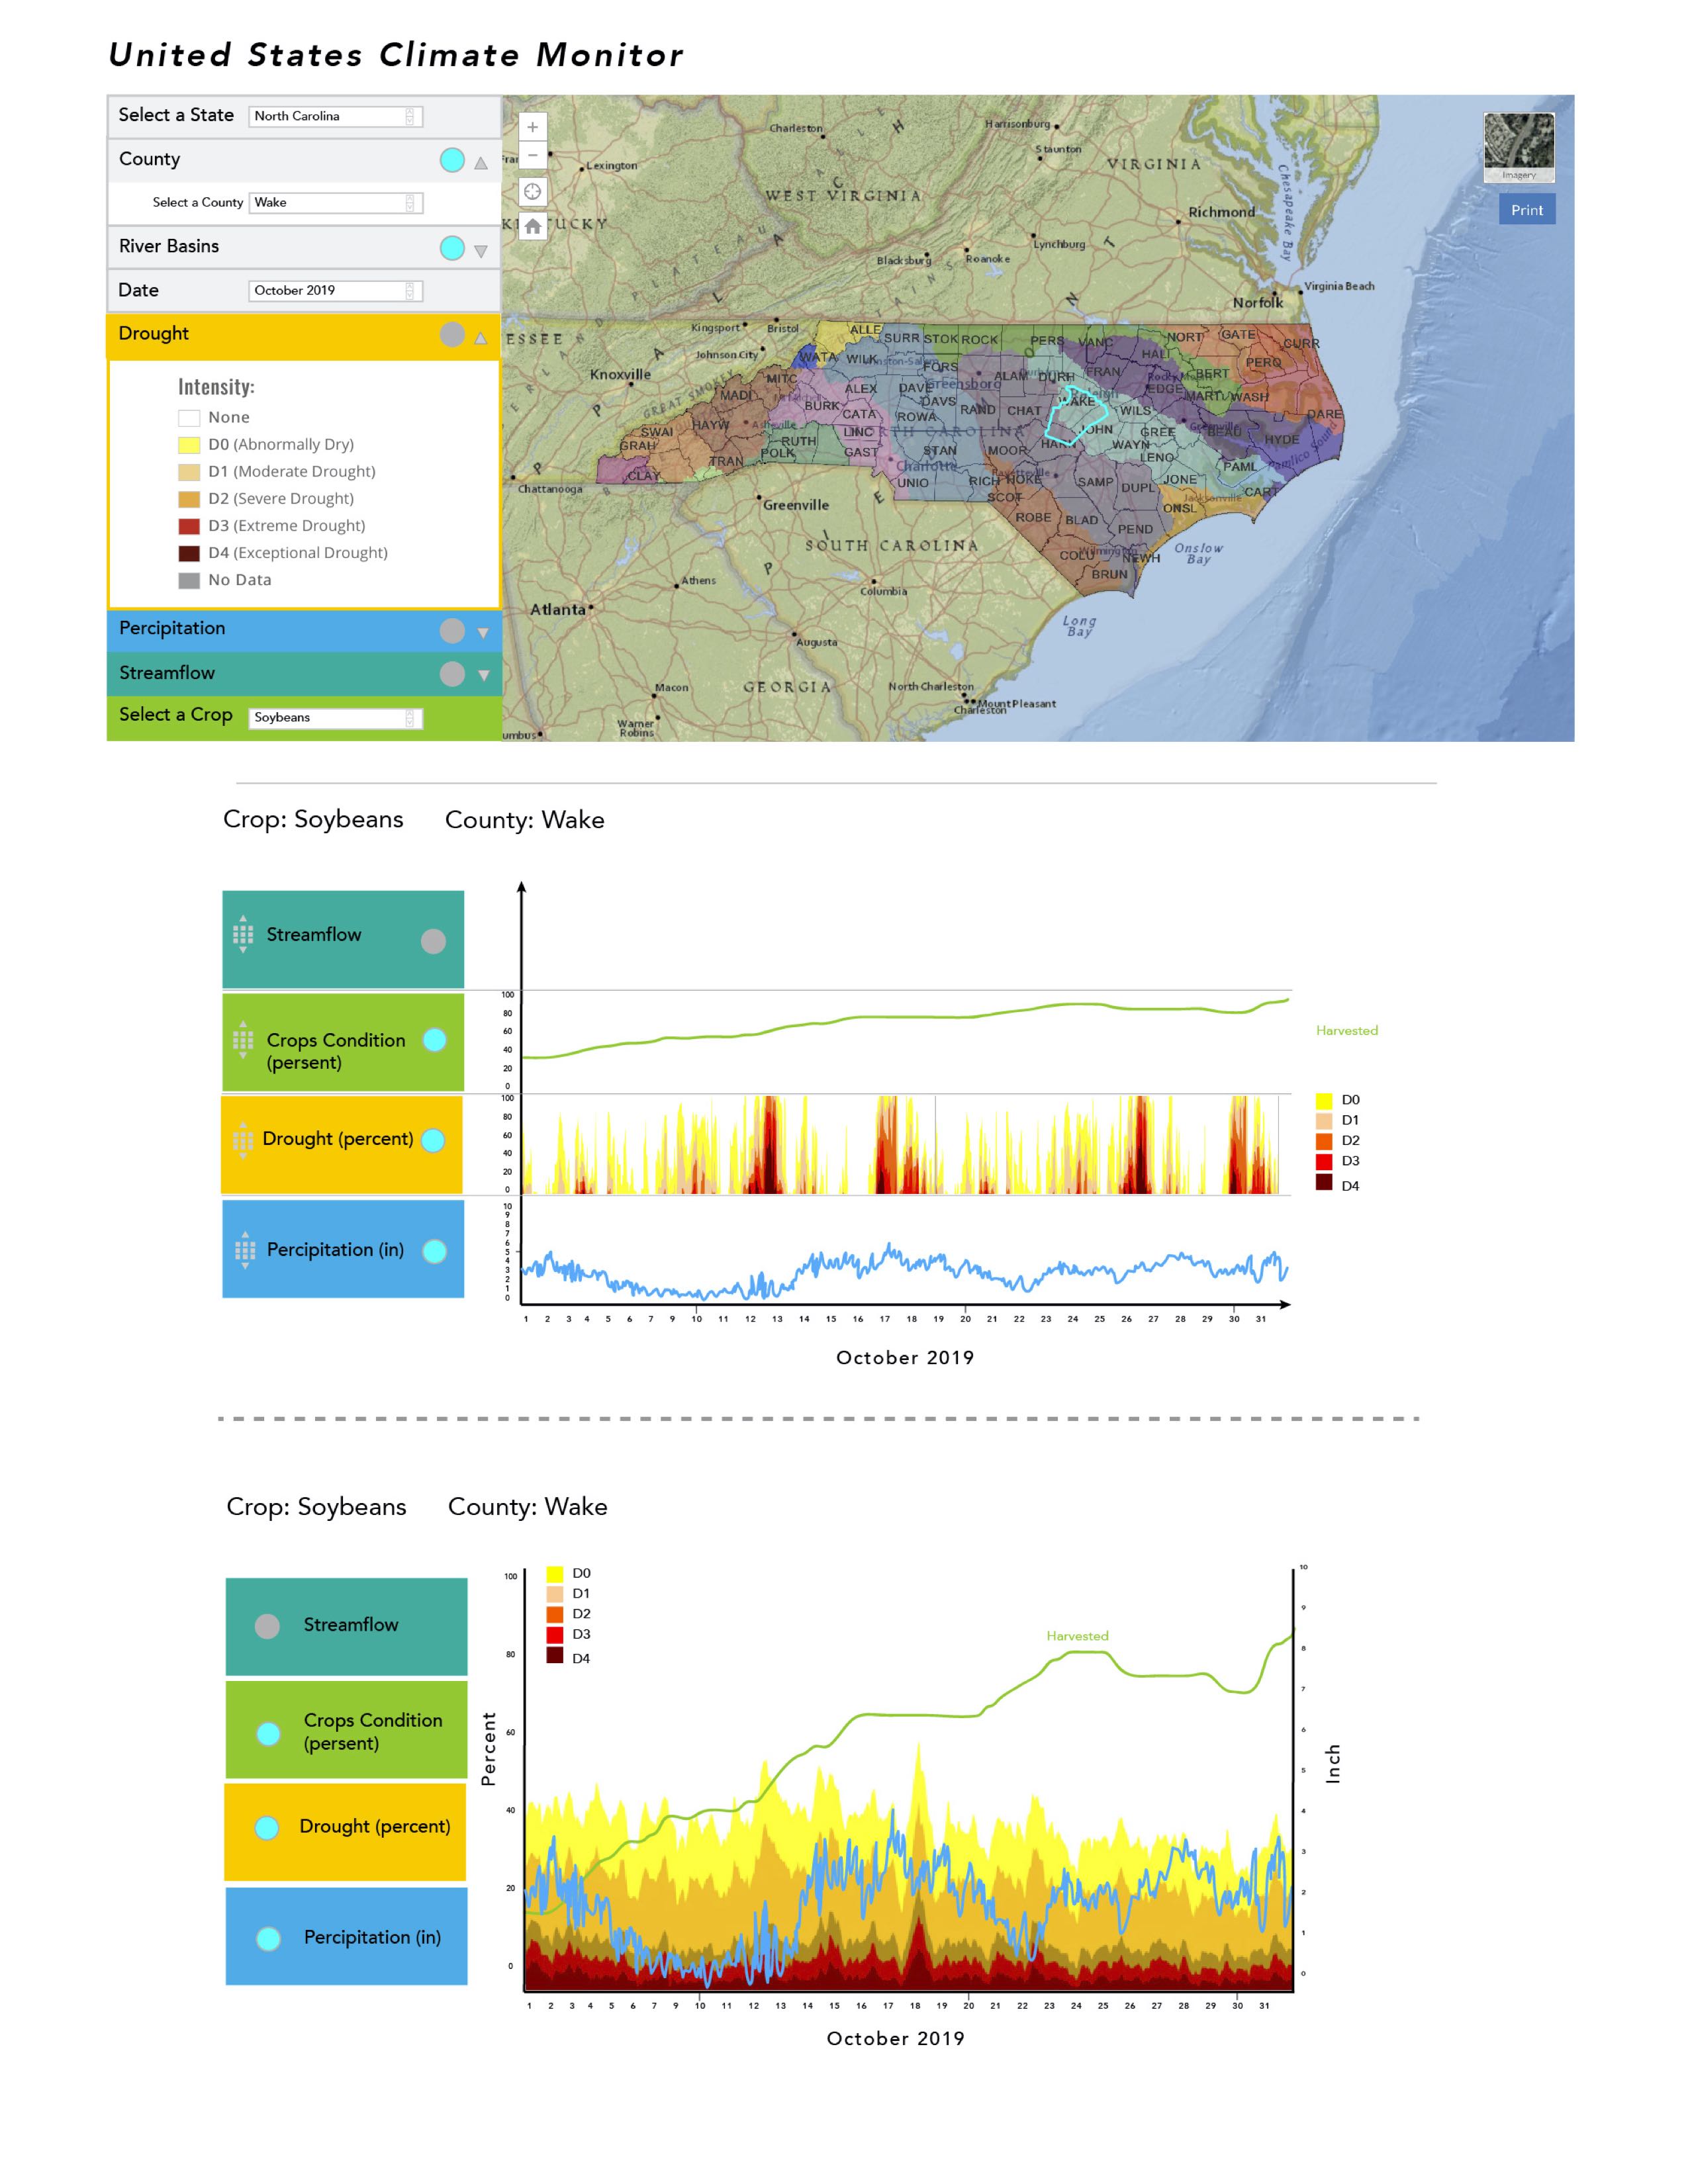
The user has selected to view the wake county and the river basin of NC state in Oct 2019. In the timeline chart, the user can see the condition of the selected crop and also the climate. I showcase two different views of the timeline. We choose to go with the first one as is much easier to see and compare the information.
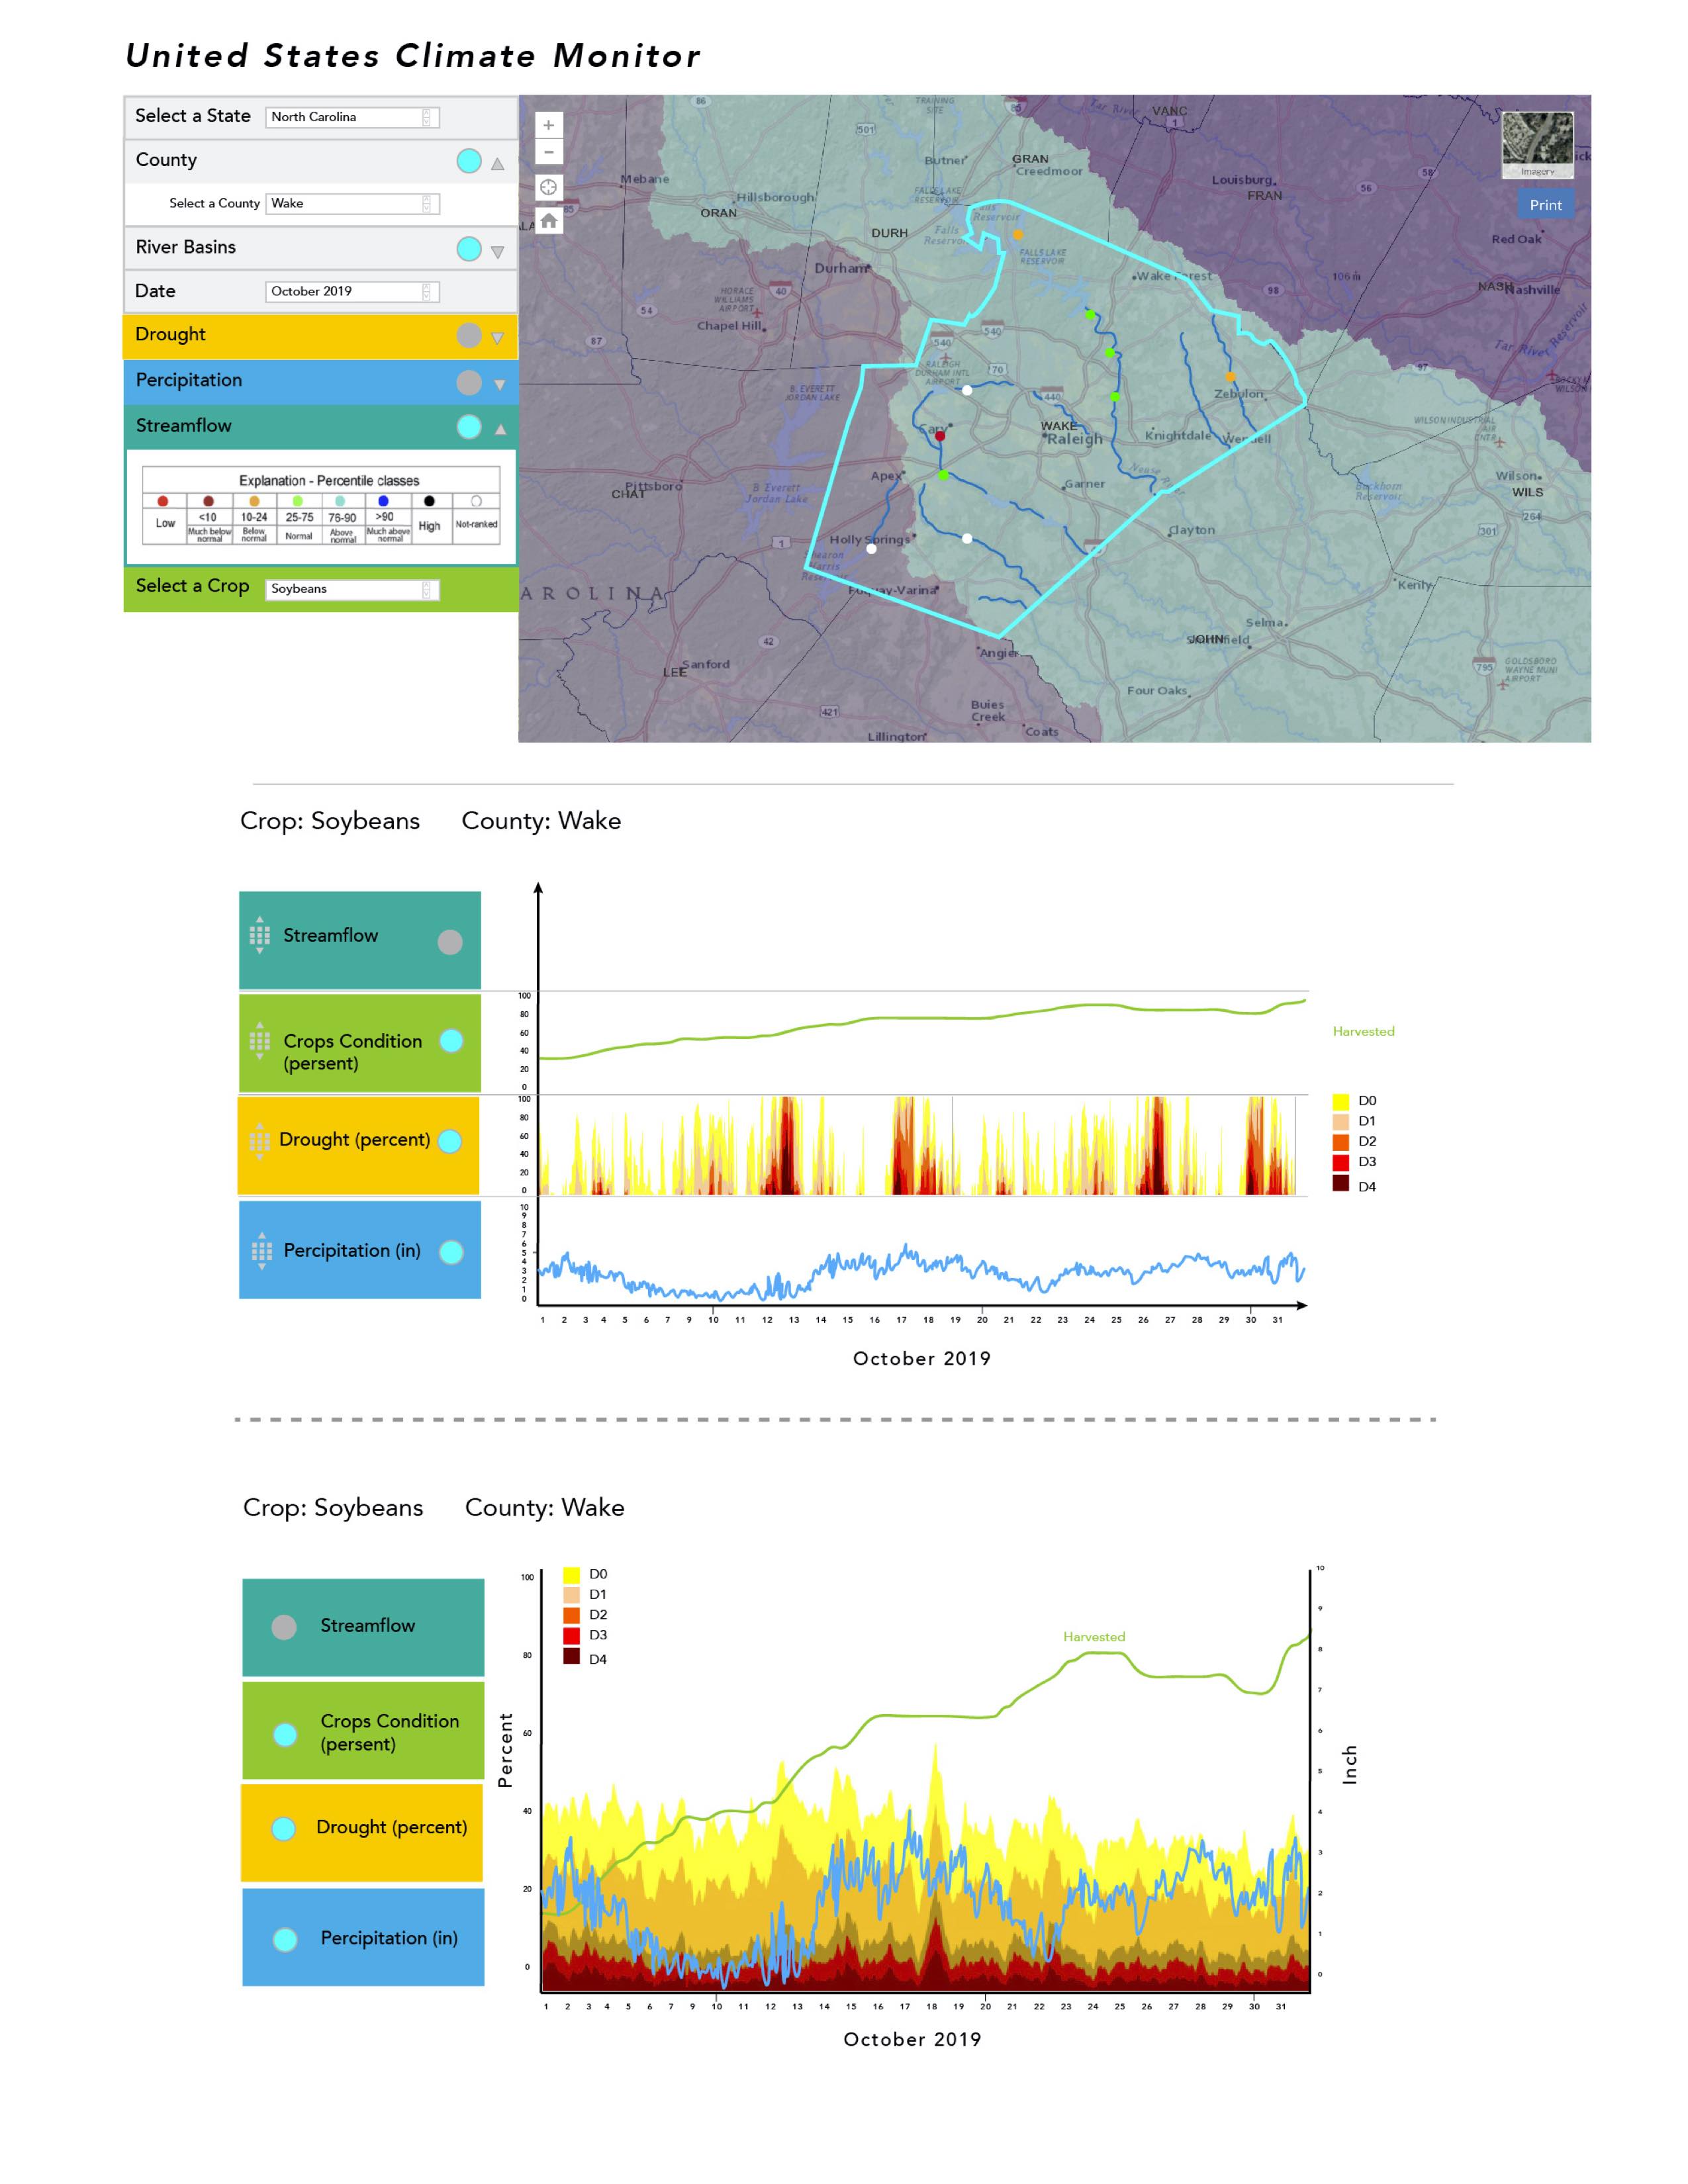
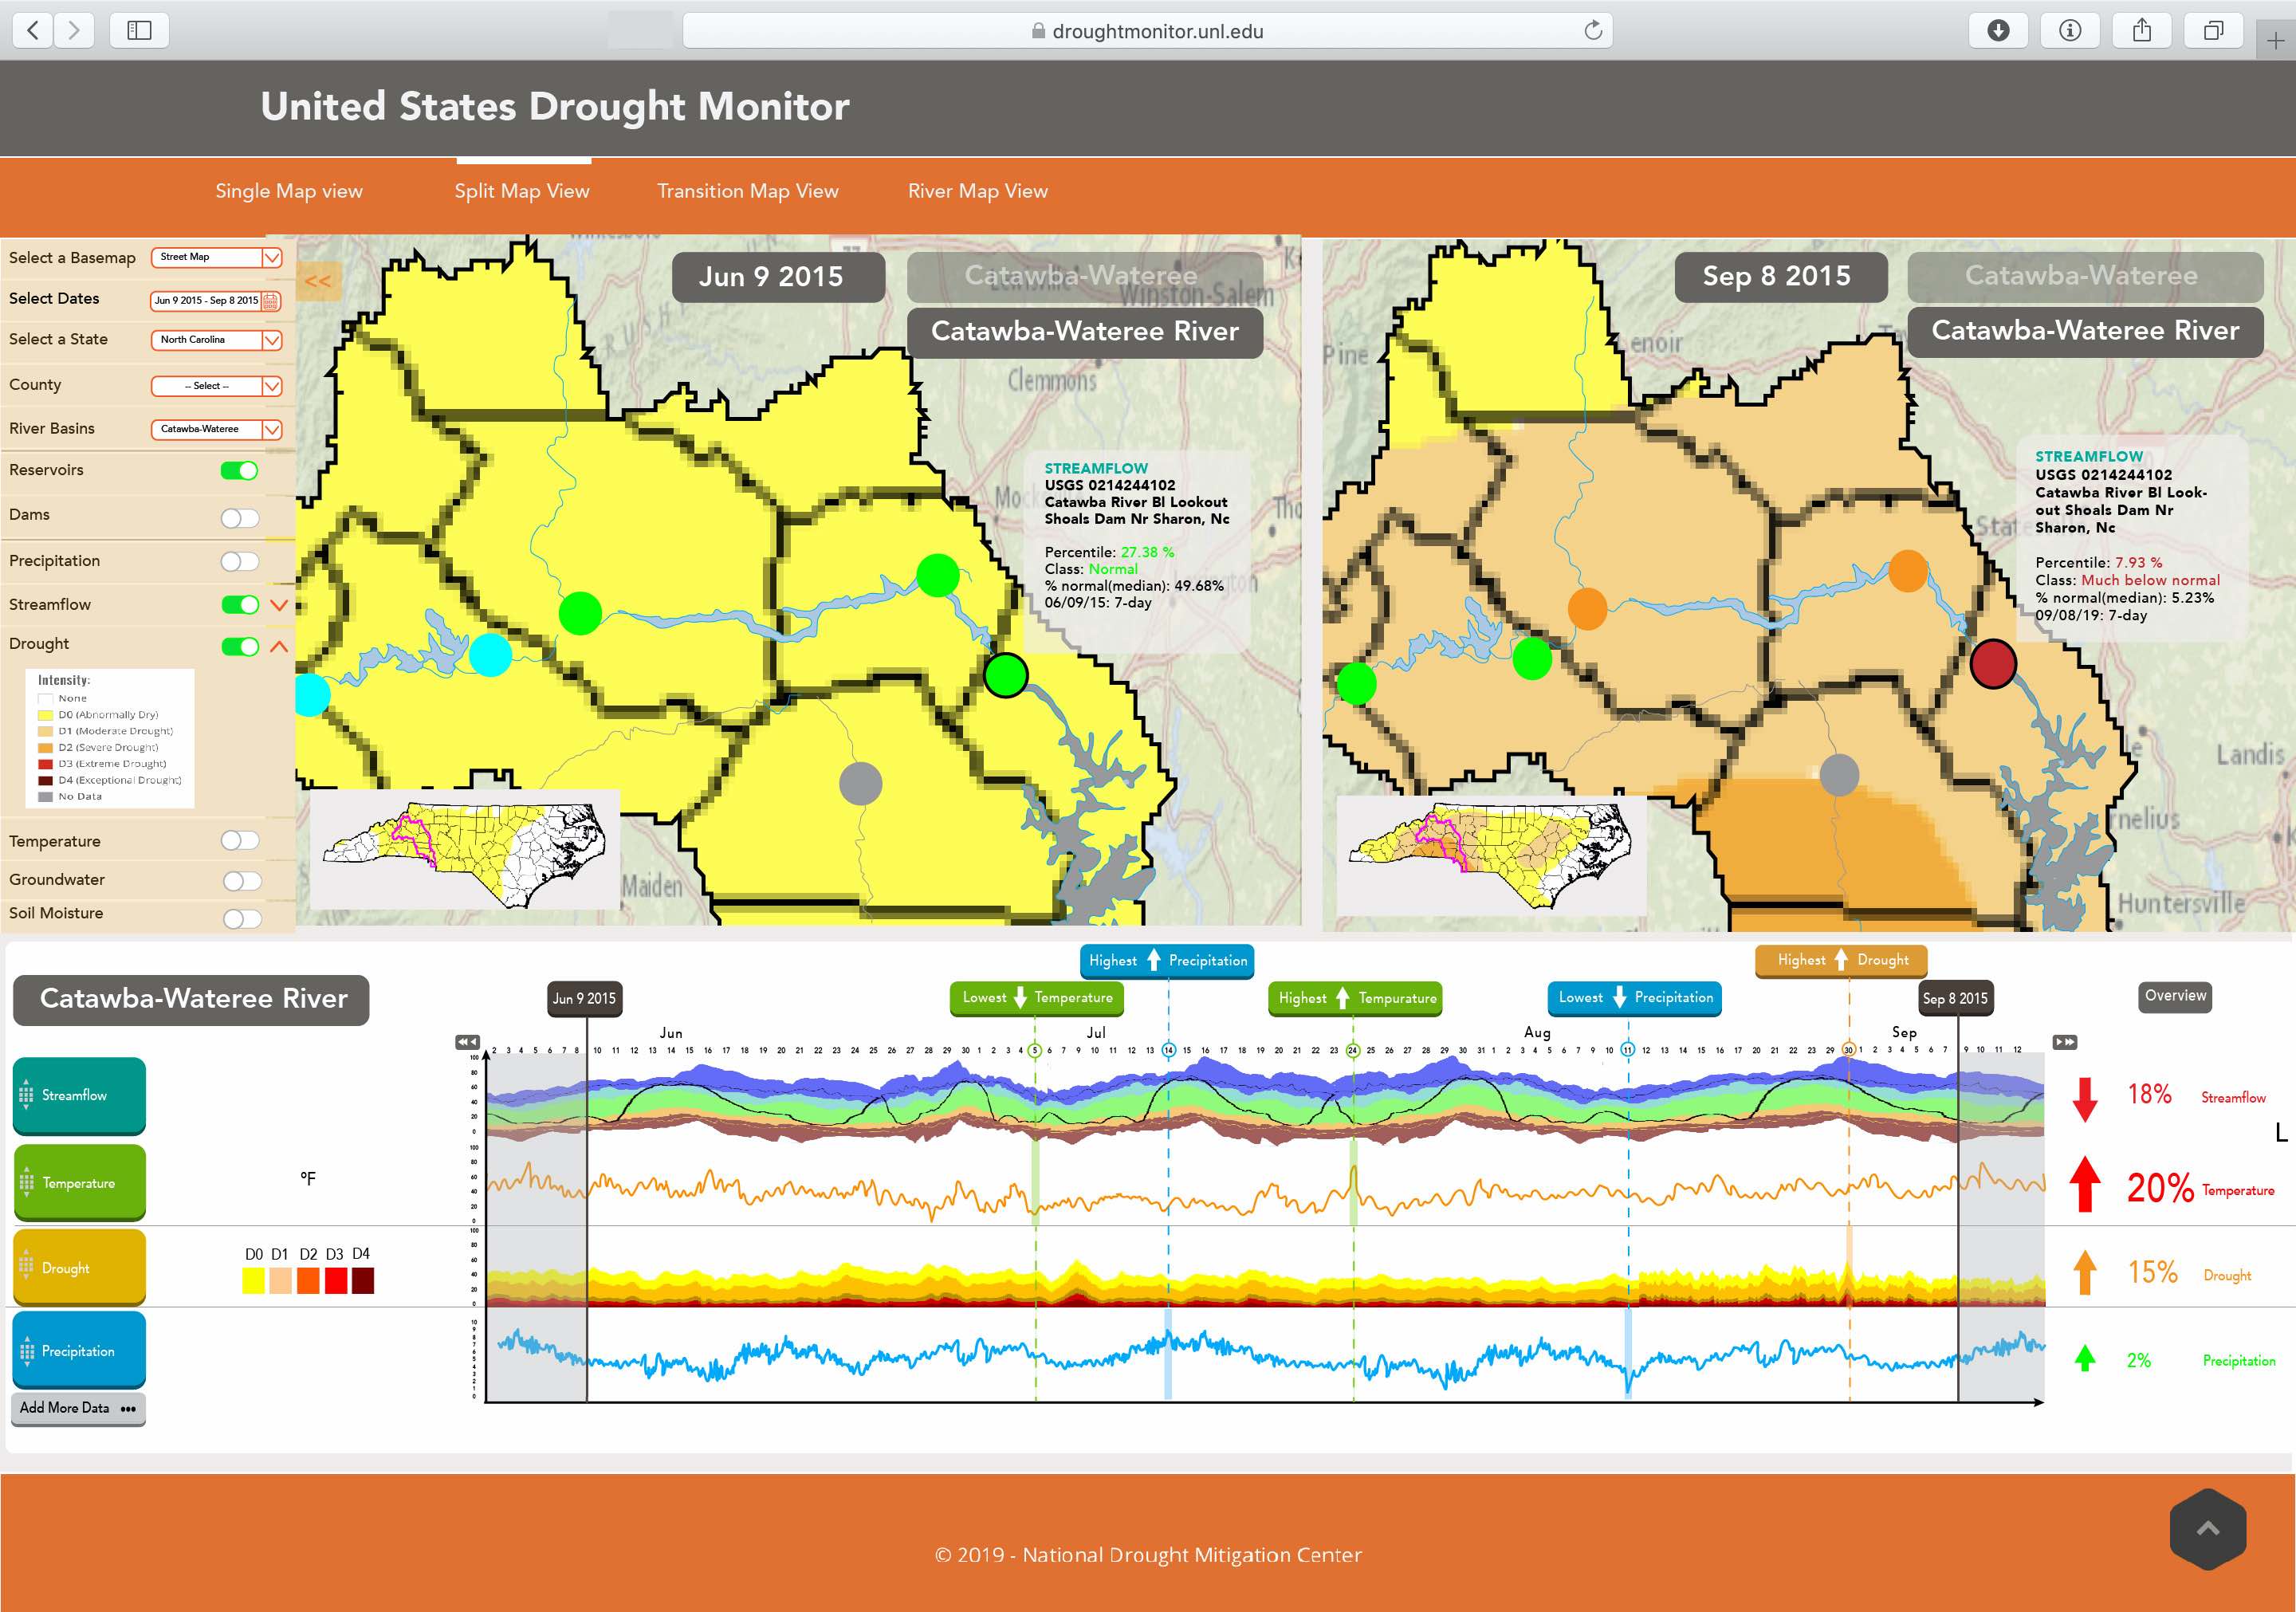
When the user doubles click on the map they can see a closer look of different information about the region.
Mockup #2
To get further with our mockup design, each of us was designated with a challenge on how to display information in an alternative interface.
I was in charge of designing the dashboard with split-view mode. But the question was how can the user make comparisons across 2D assets arranged in a 2D space?
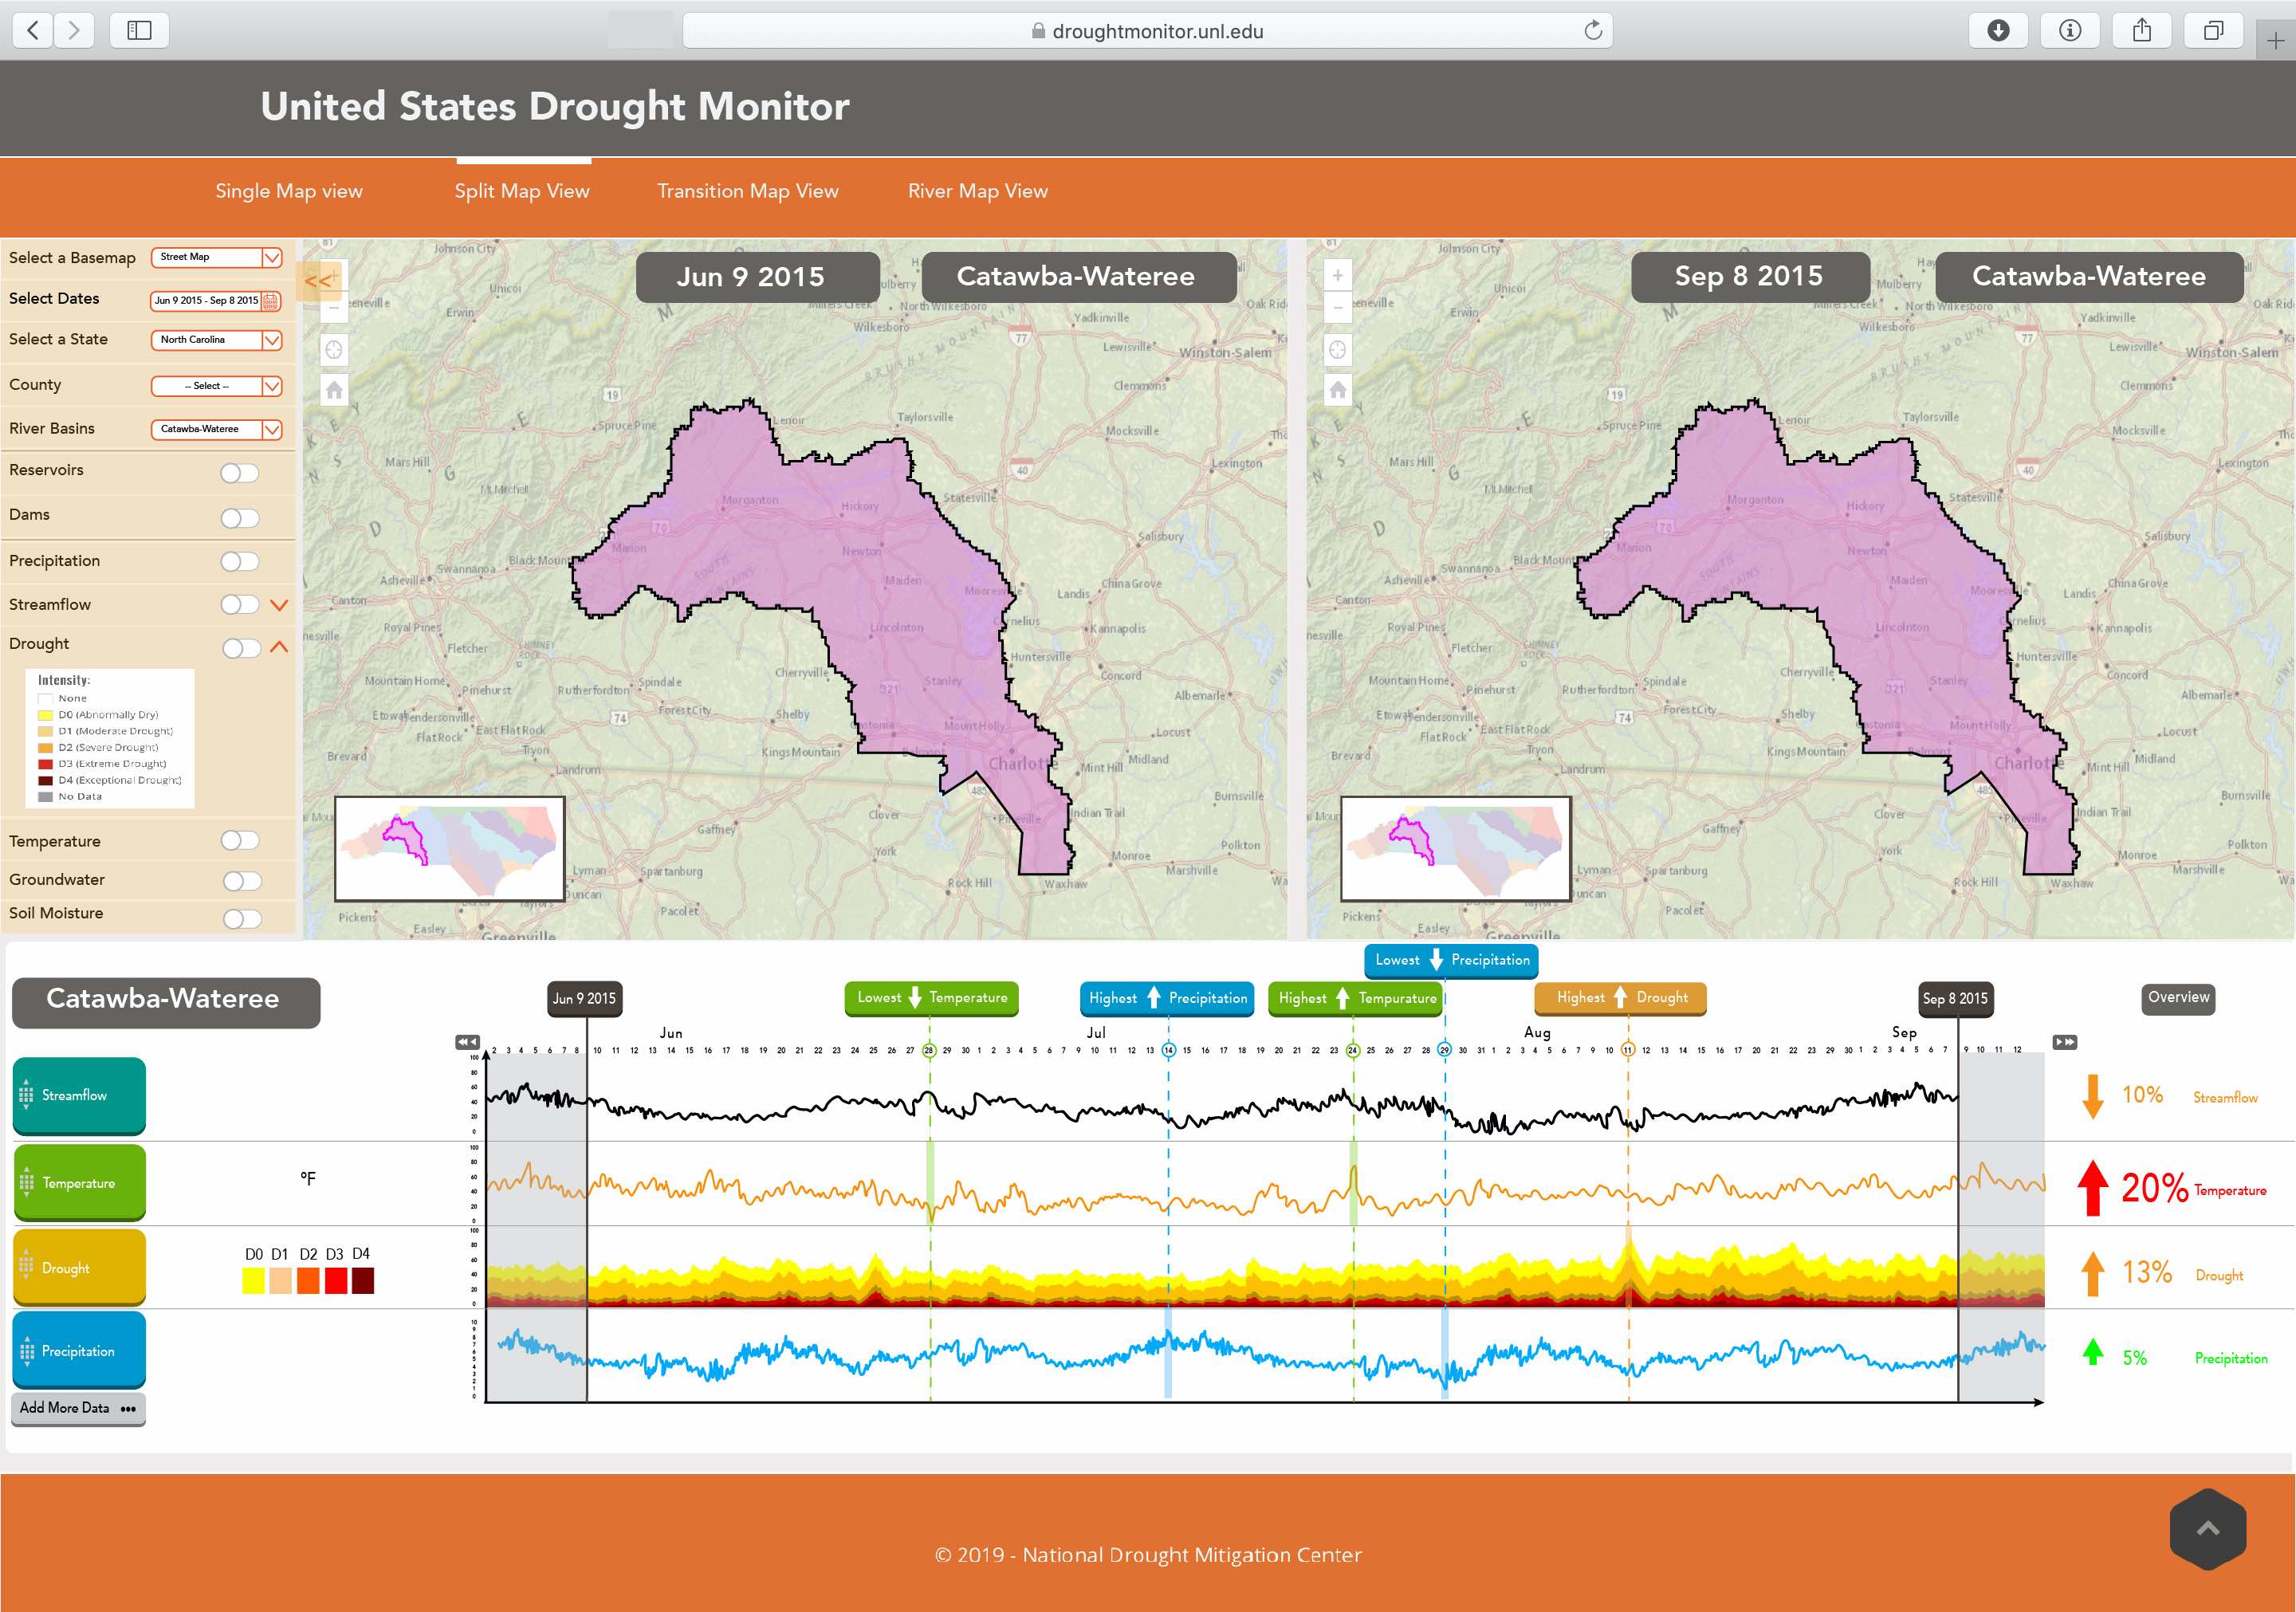
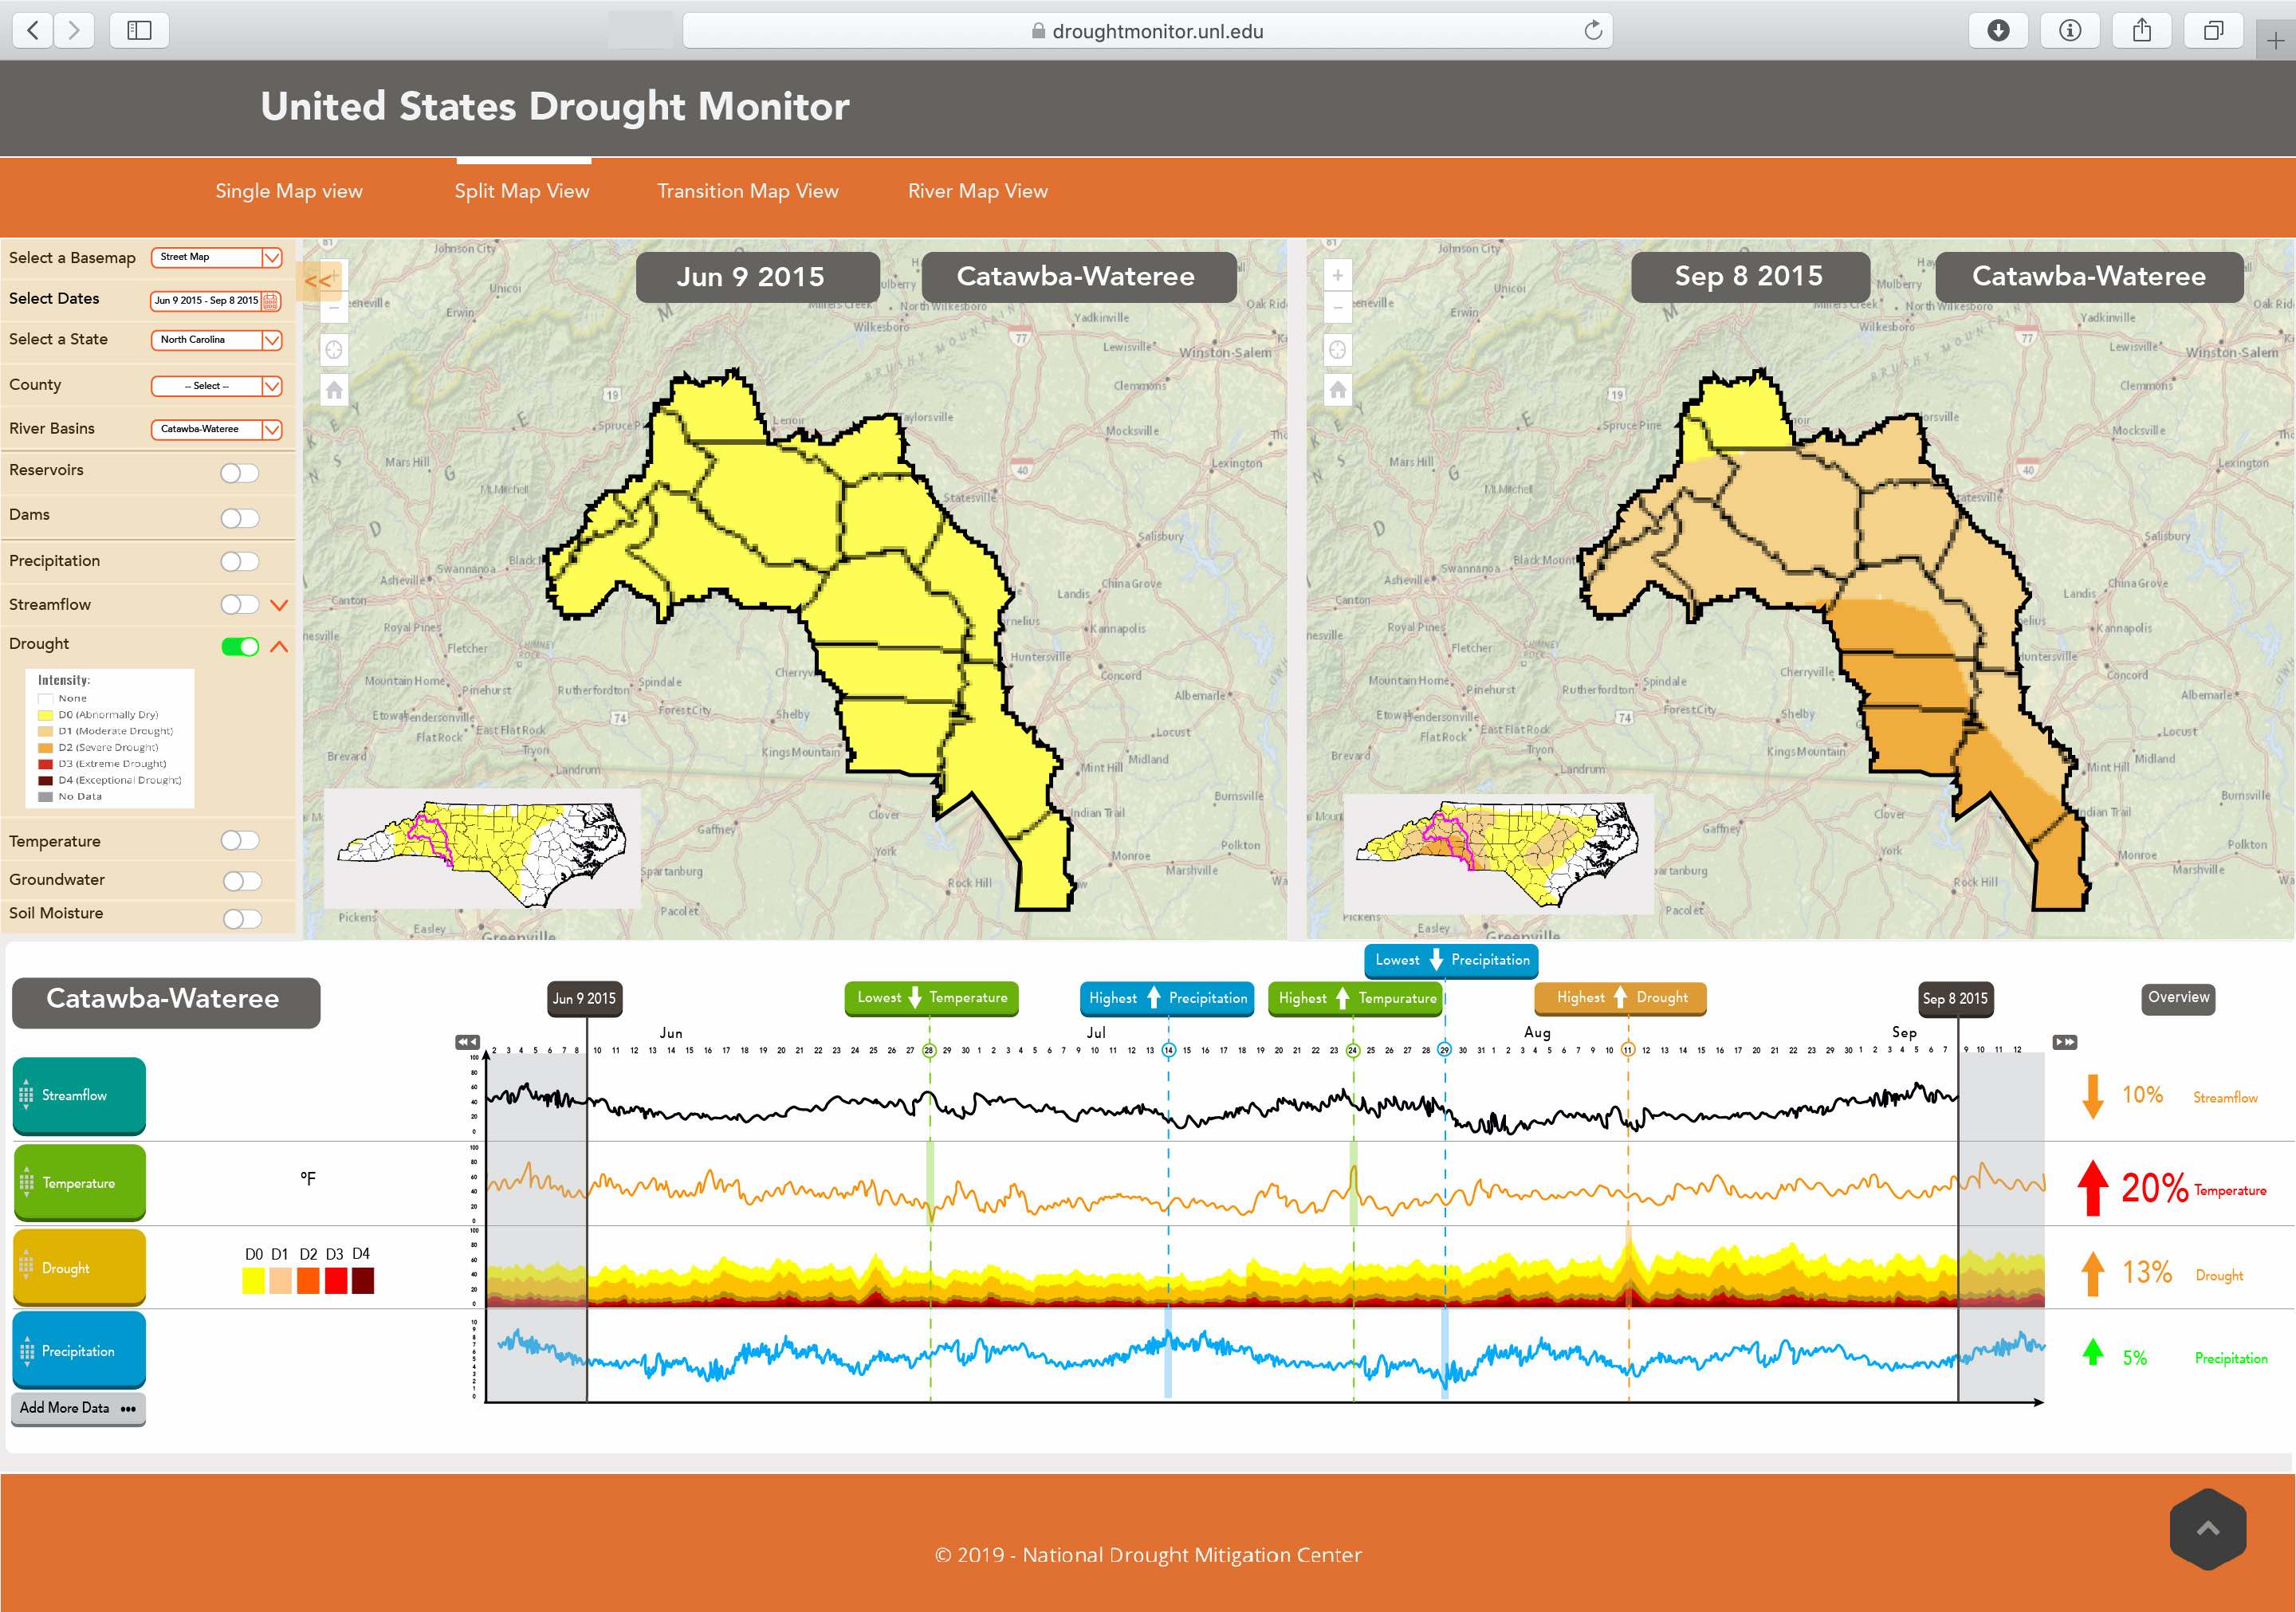
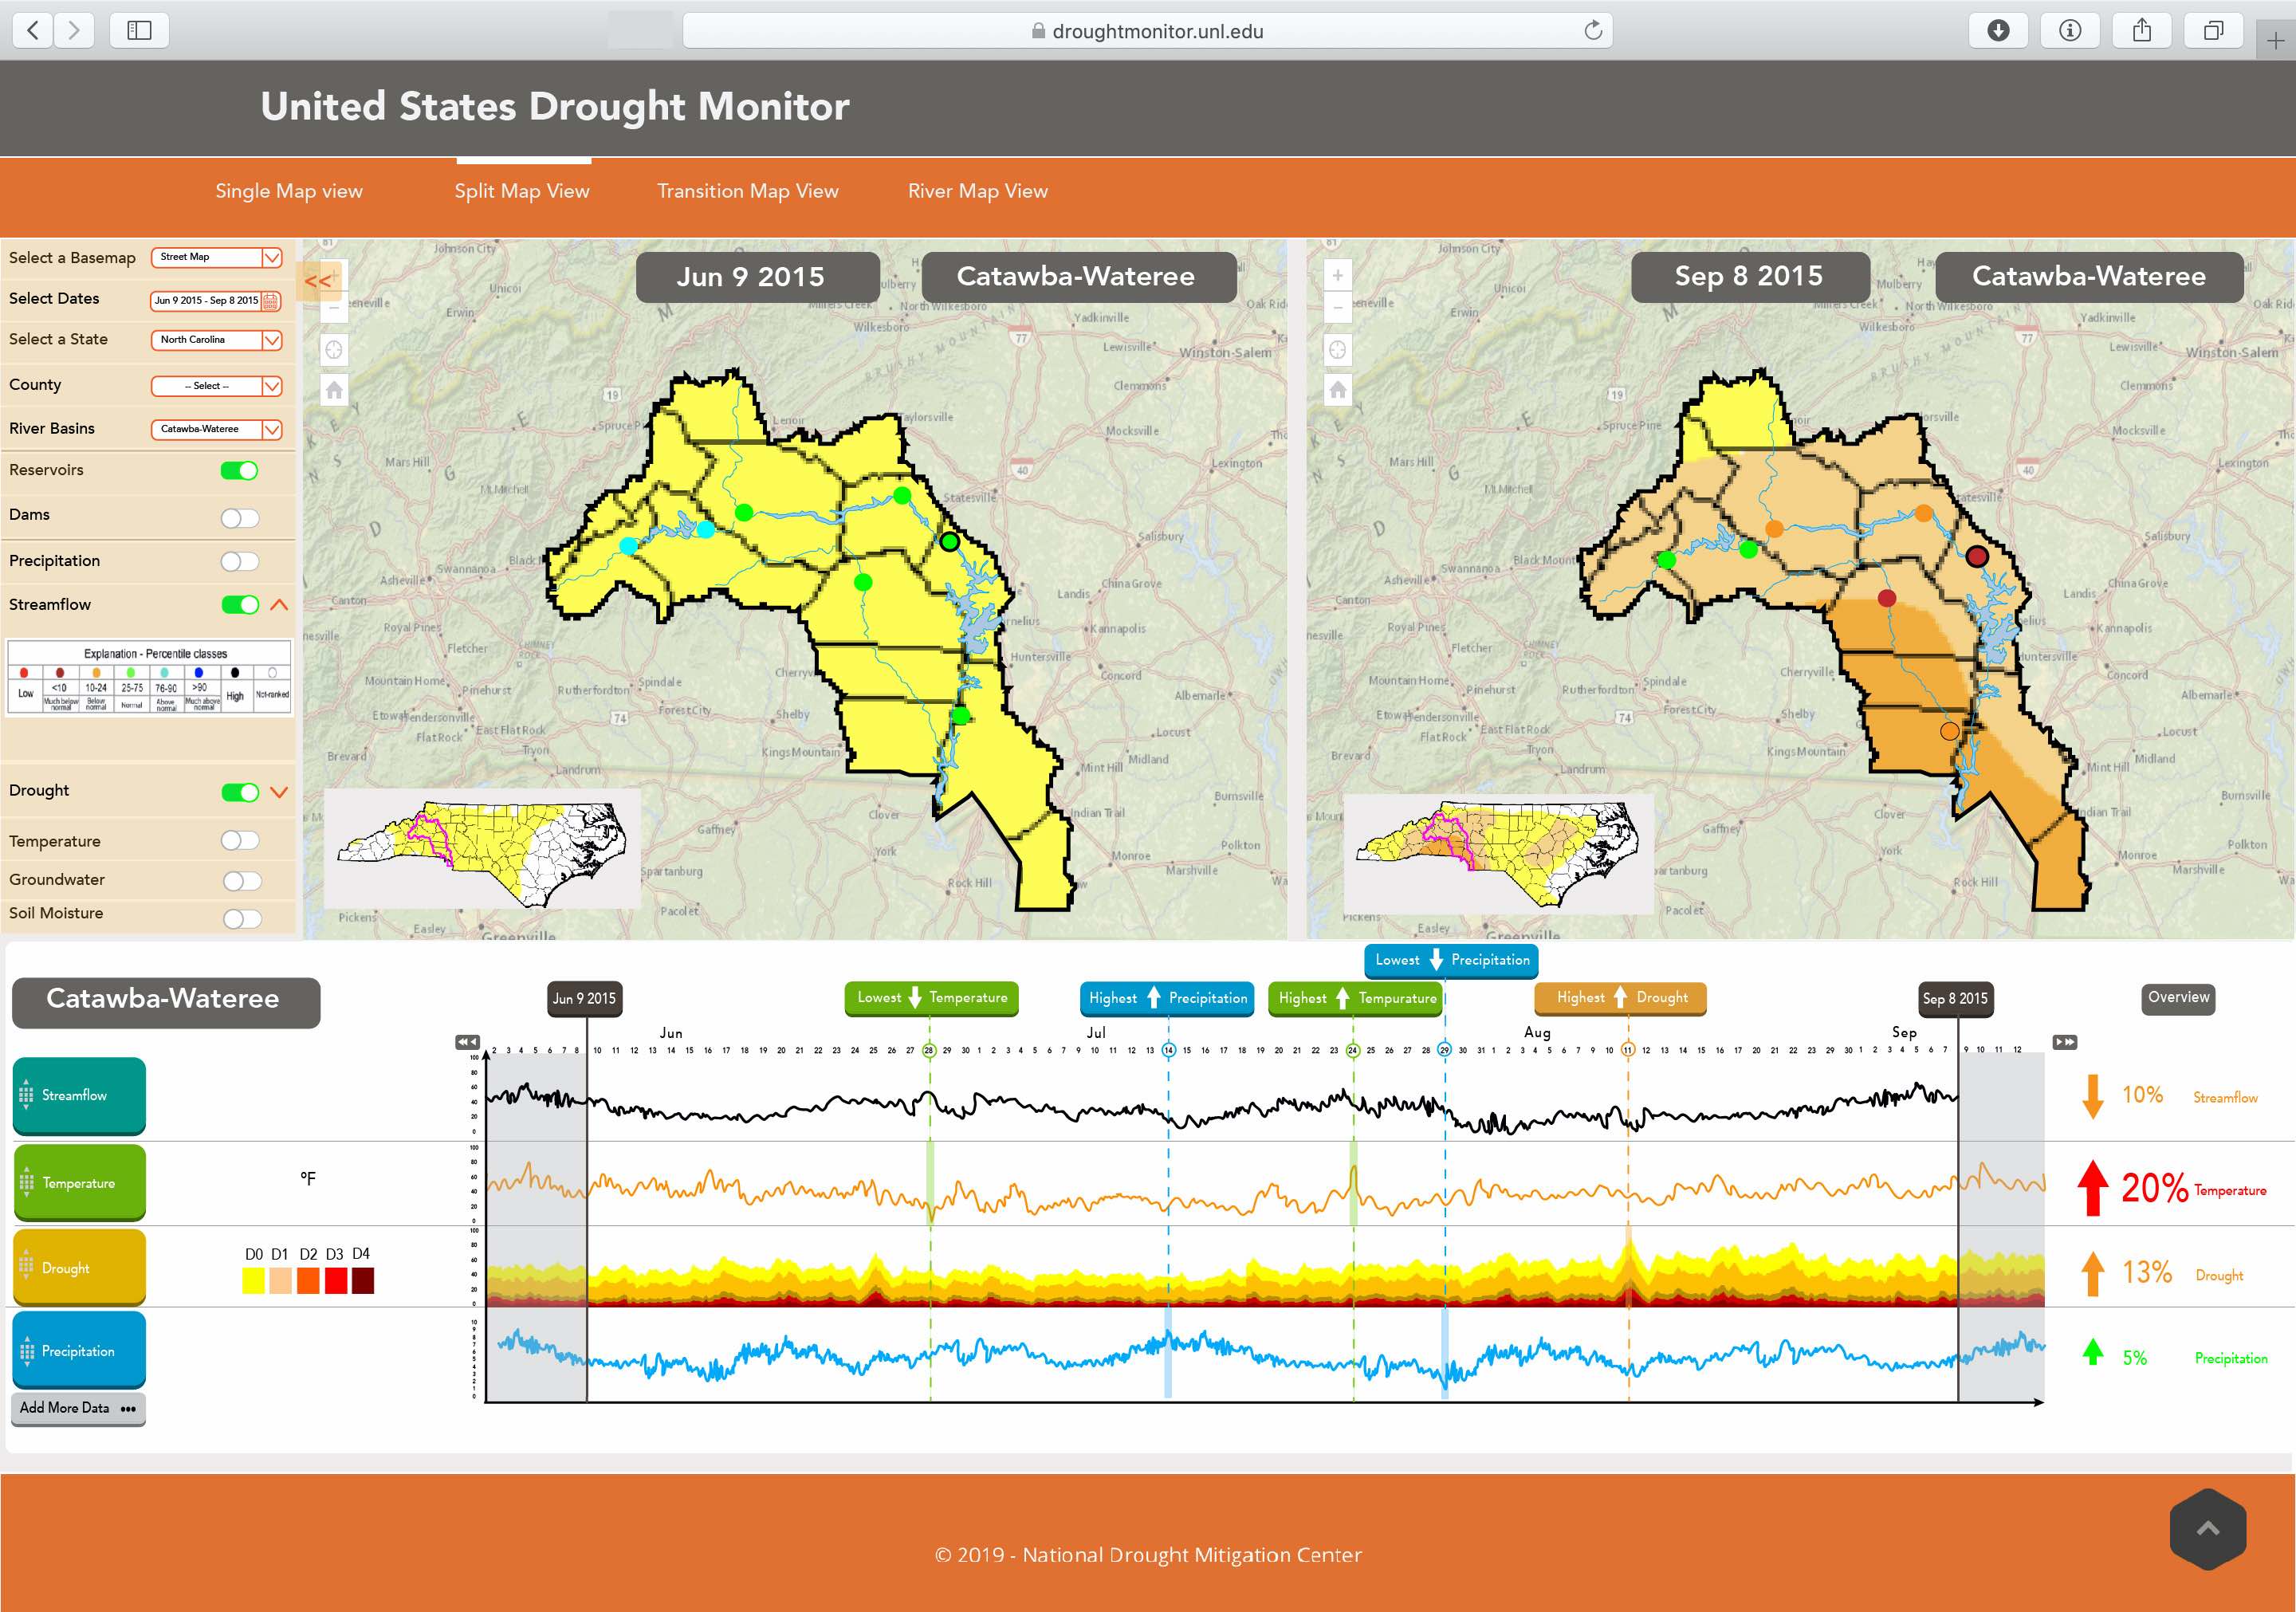
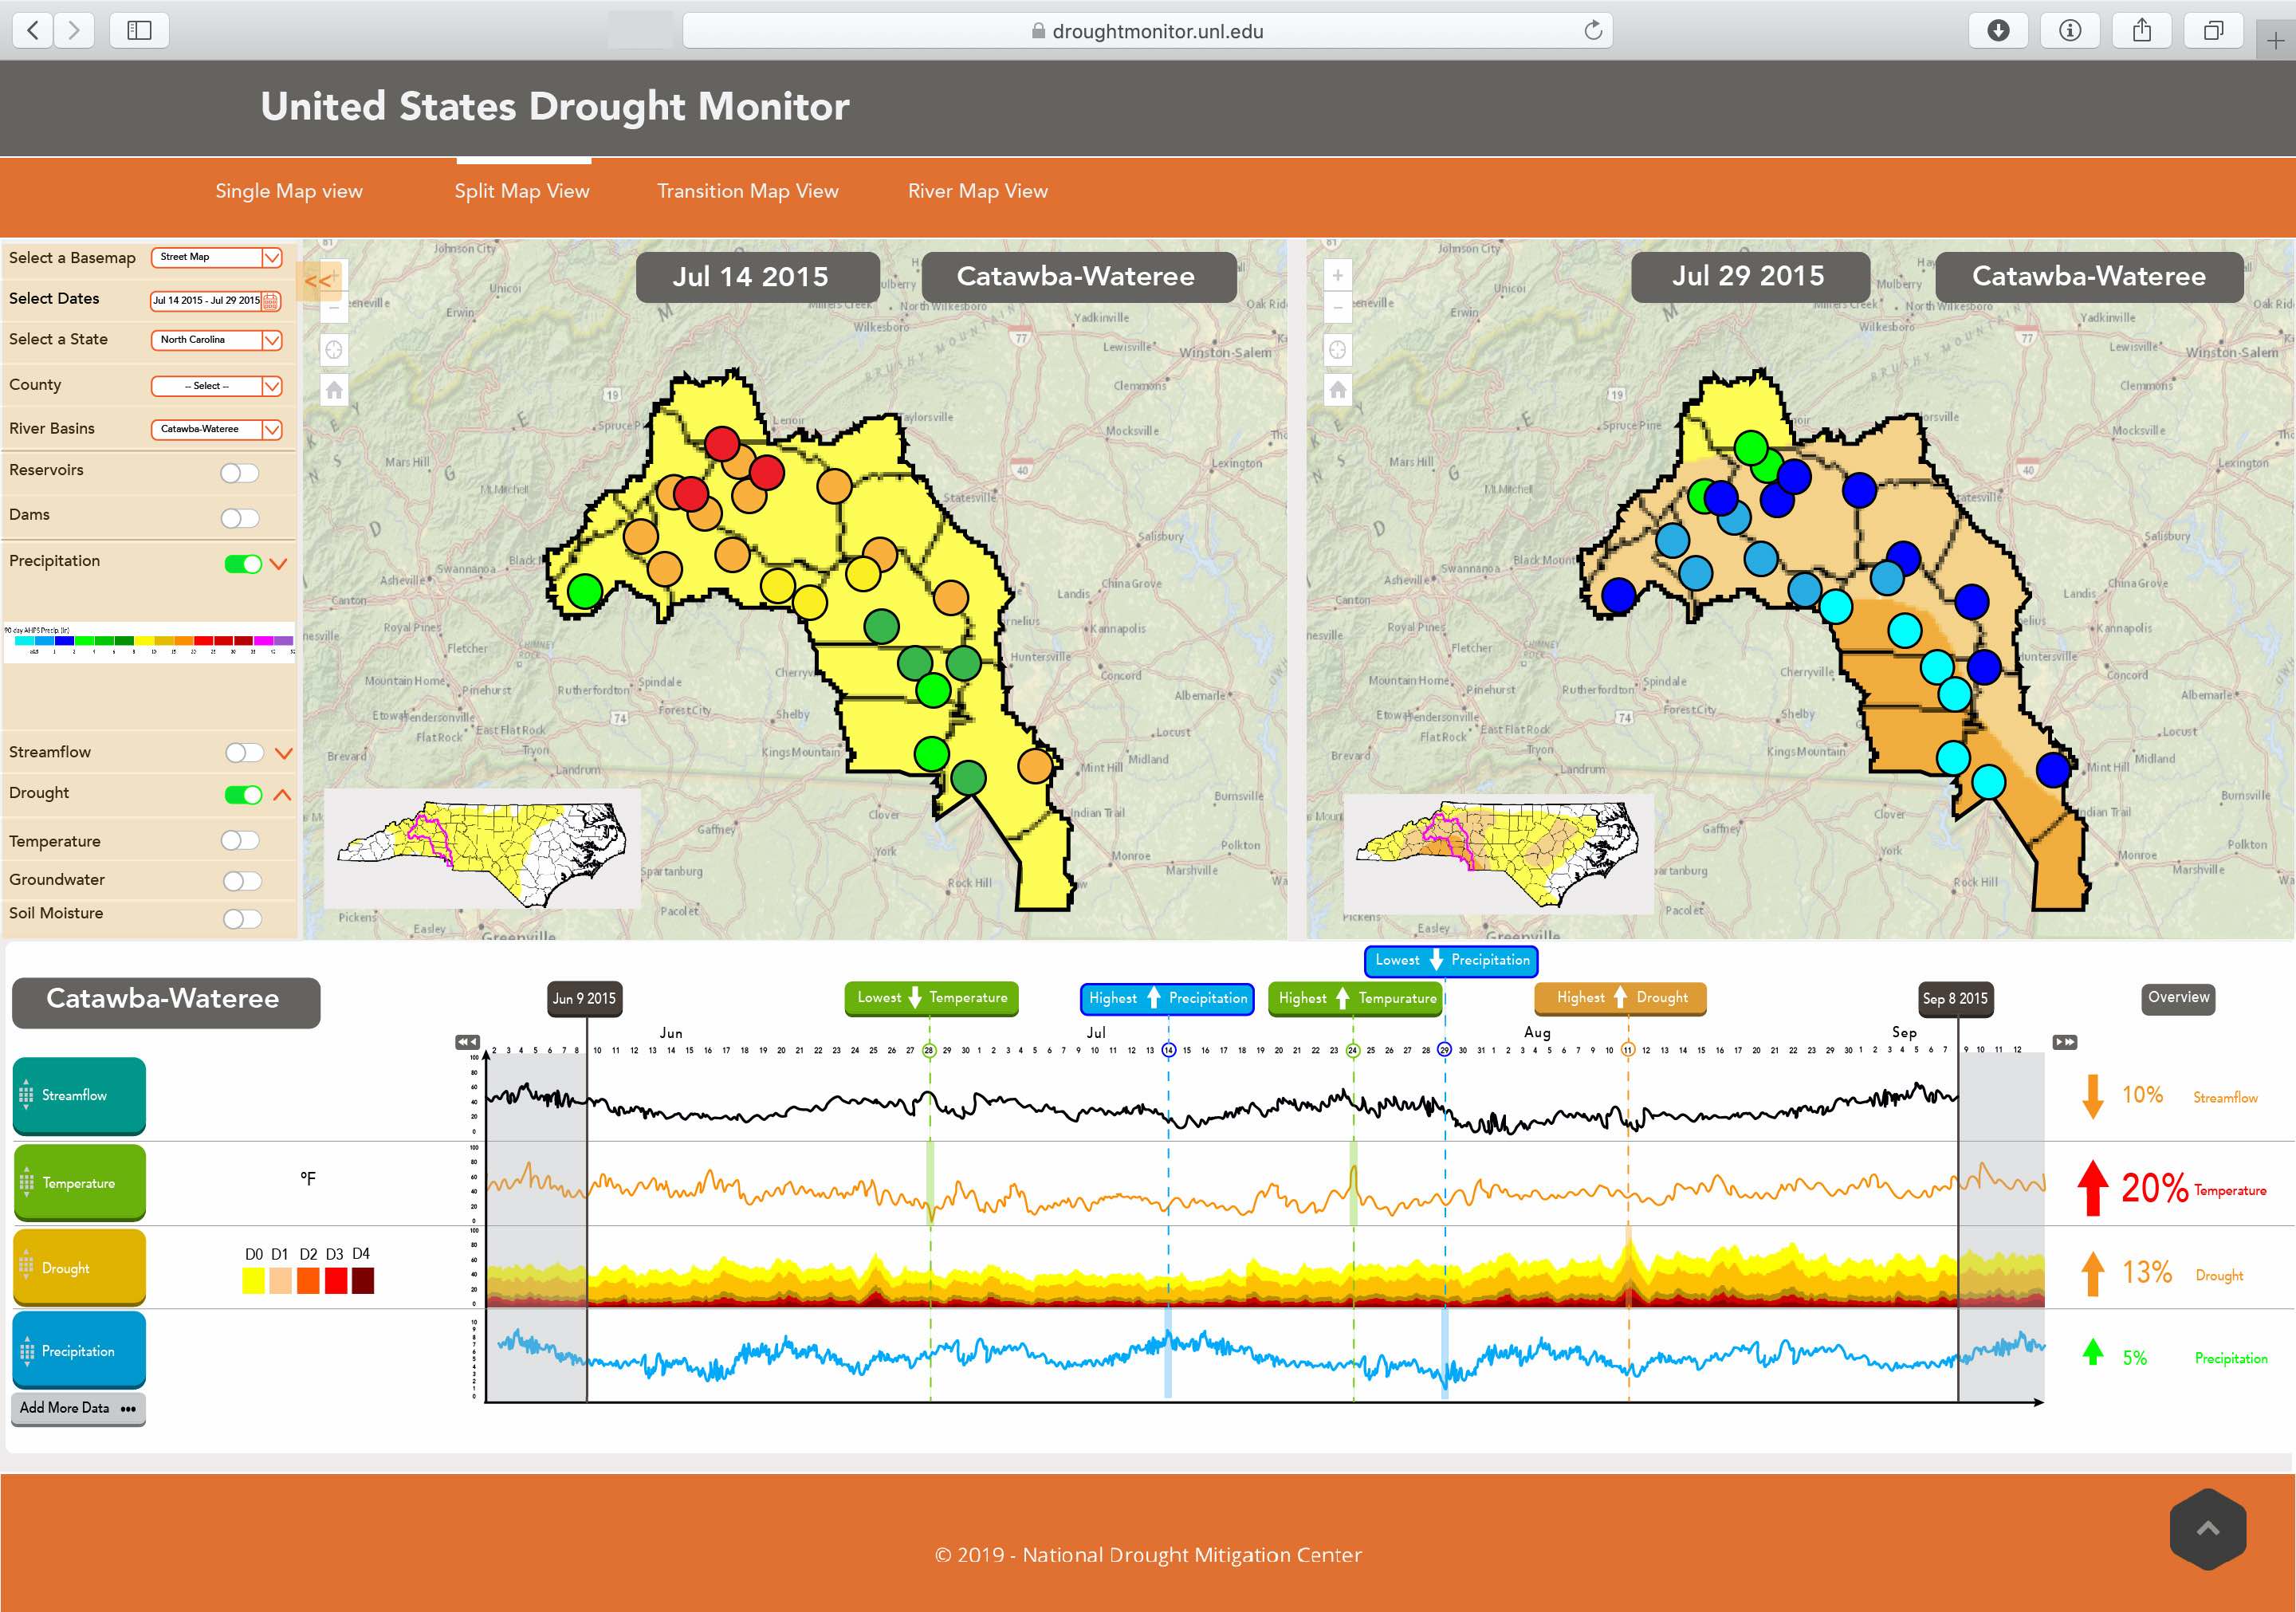
After much research and comparison to other slipt view mode models in the market, I came with this dashboard design where the user can select a different view mode to see the information. And they can have the freedom to choose what information to see on the map or in the timeline chart.
In general, the split-view mode lets the user select two dates, and the climate information about these two dates are displayed simultaneously within the map portion of the screen. The timeline chart view changes accordingly.
Single Map view
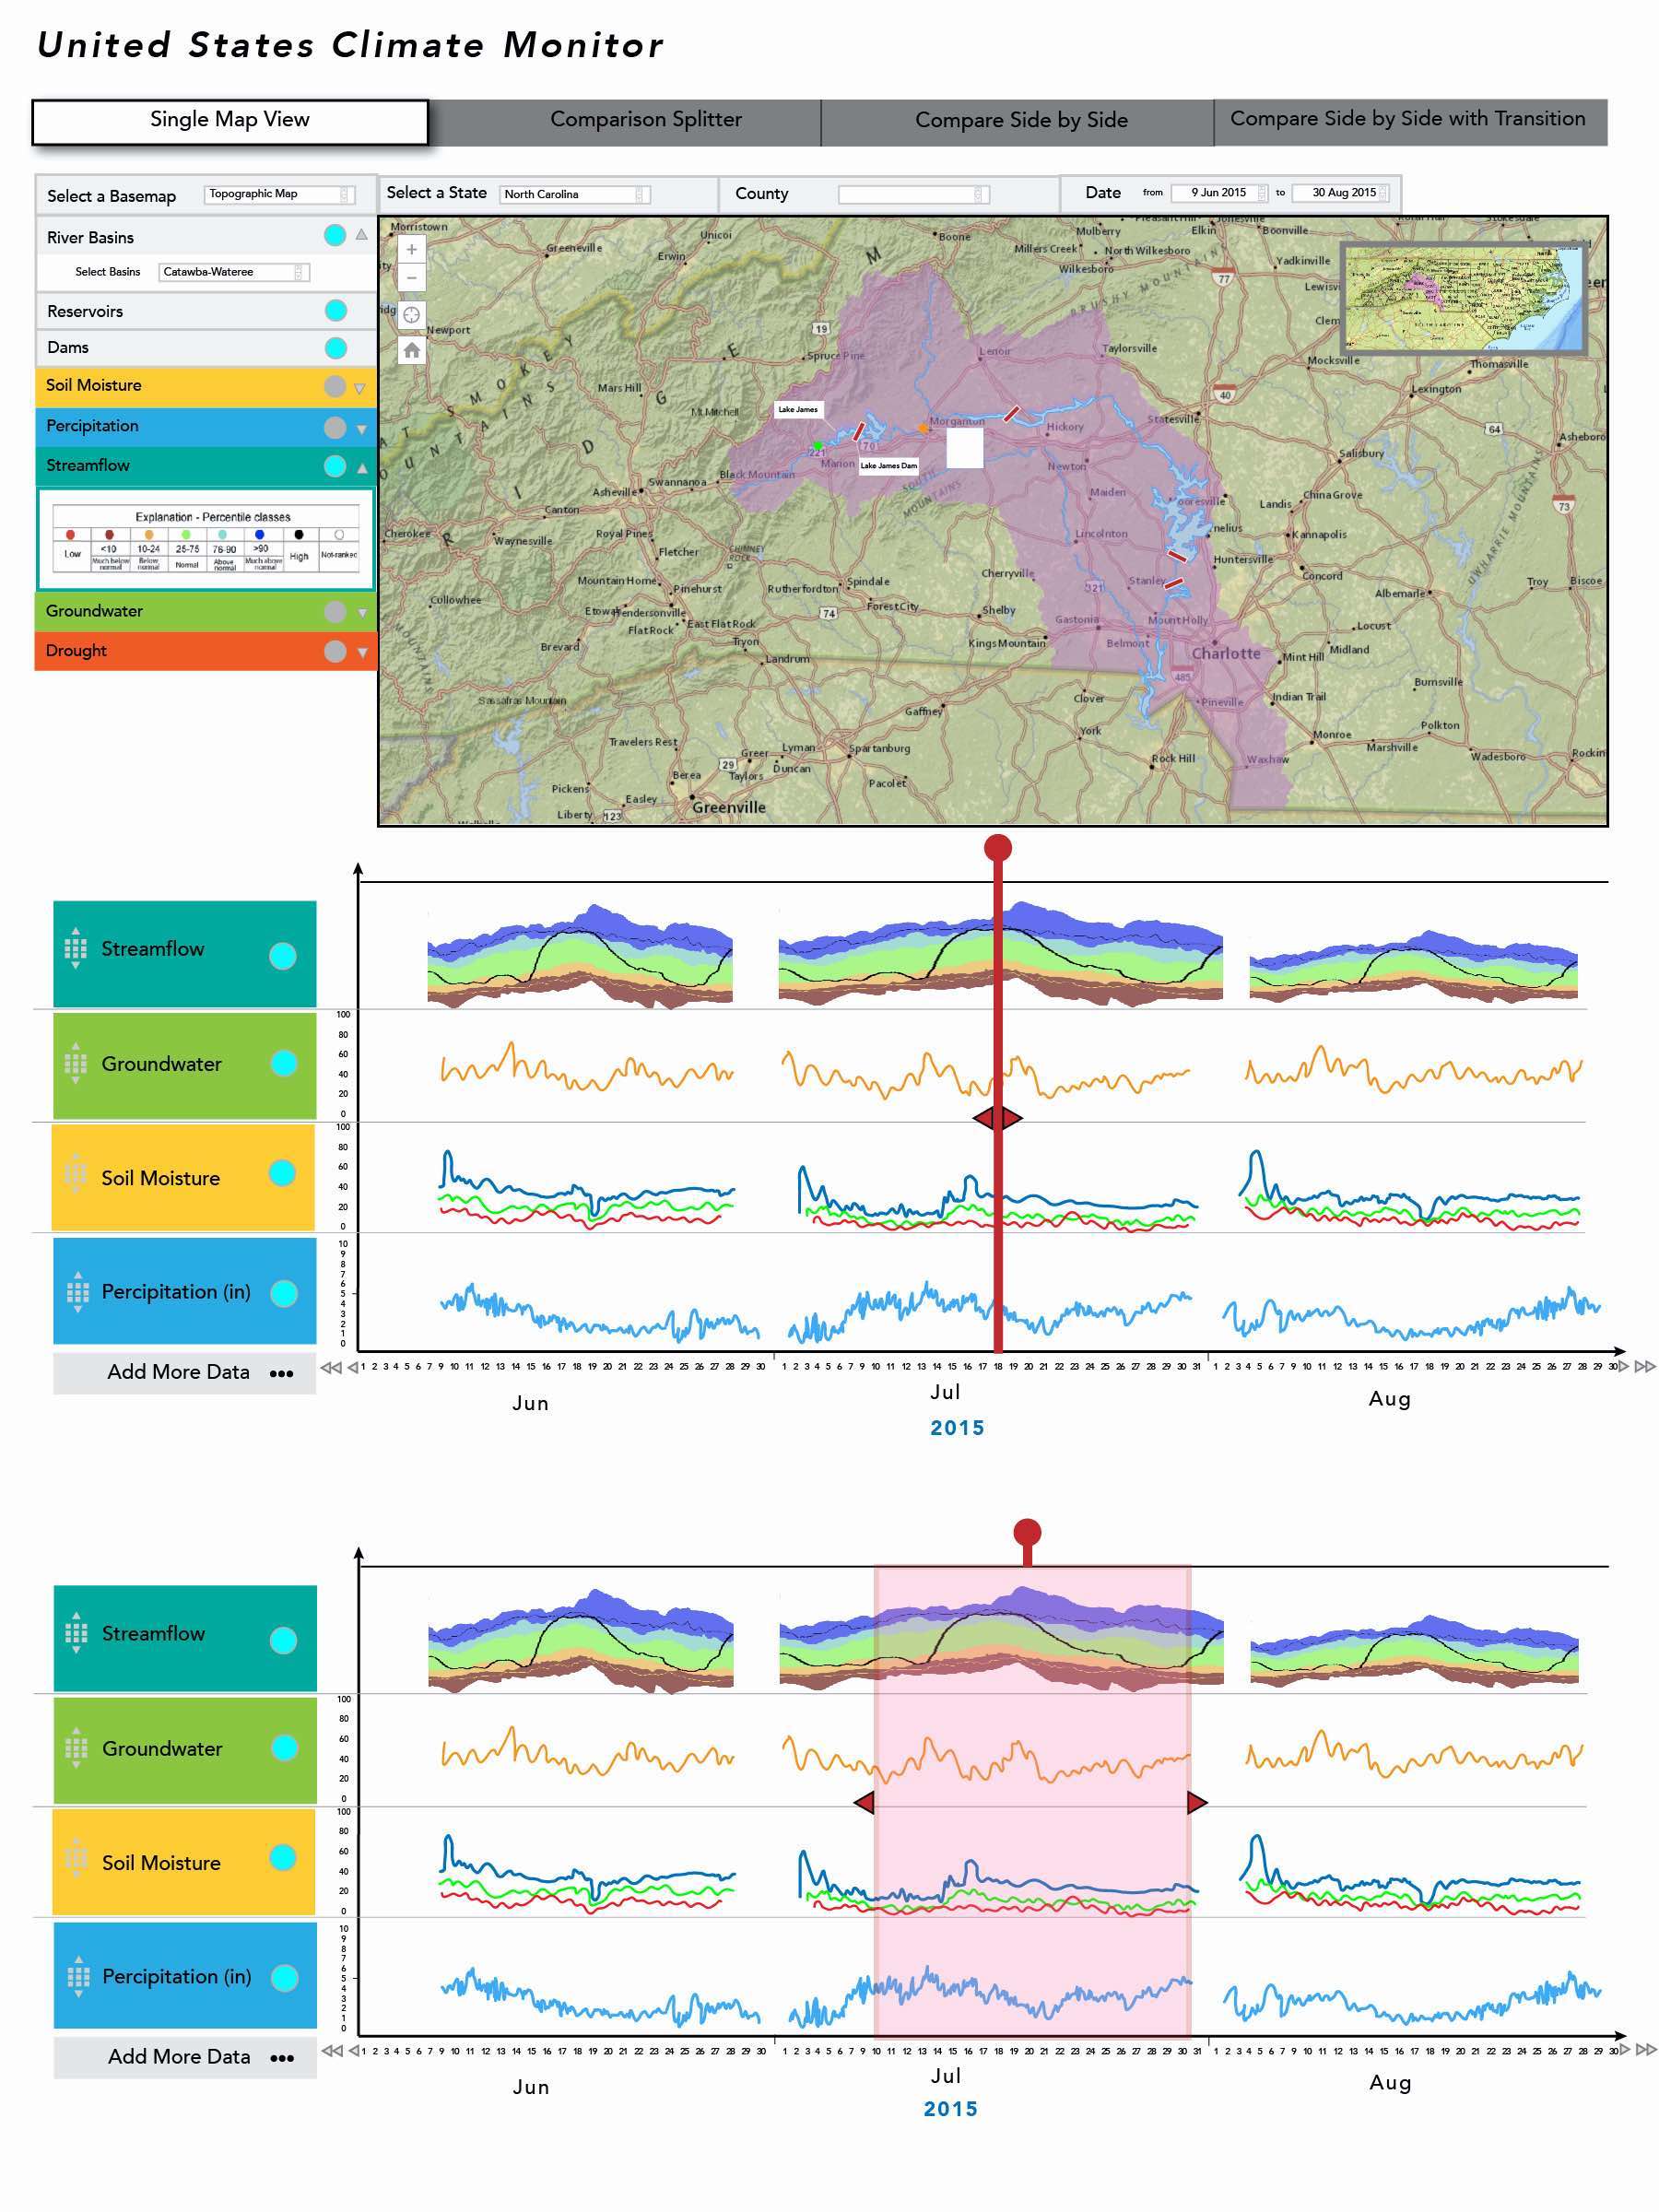
Comparison Splitter view
Comparison Side by Side view
Compare Side by Side with Transition view
Final Mockup
And last but not least
After several weeks of research and refinement, we presented our ideas to the climate office as examples of the range of visualization styles and types of interactions that might be useful for the final rebuild of their website.
In the right corner of the timeline graph, I have added an overview section where the user can see climate changes from the two selected dates by just looking at the scale and color number. This addition solved one of the major problems of our clients, which was finding a way to demonstrate visually, complex information between two time periods.
My reflection...
- This project was an opportunity to work with real scientists as our clients. We needed to understand their problems and then translate them to different design solutions.
- Critiques and communications were a big part of our design process. They were really helpful and important to understand better what are the needs of our clients.
Uh oh, you have reached the end of this case study!
Do not worry! I have other projects that are waiting for you to check them out!
Thank you for your time and see you in the next project :)